9.1 Choosing the Correct Test
It is important that you learn how to identify which inferential statistic you should perform. You do not need to memorize every statistical test in existence. That would be a terrible use of your time and, honestly, pretty miserable.
Instead, I want you to learn how to ask the right questions.
The test you choose depends mostly on:
- what kind of dependent variable you have;
- what kind of independent variable(s) or predictor(s) you have;
- how many variables, groups, levels, or time points are involved;
- whether the same or different participants are in each condition;
- whether the assumptions for the planned test are reasonable.
This is where the material from types of variables and levels of measurement, describing data, and visualizing data starts to come together.
A decision tool for choosing tests
The chart below can help you determine what statistical test to perform. It is a map, not something you need to memorize.
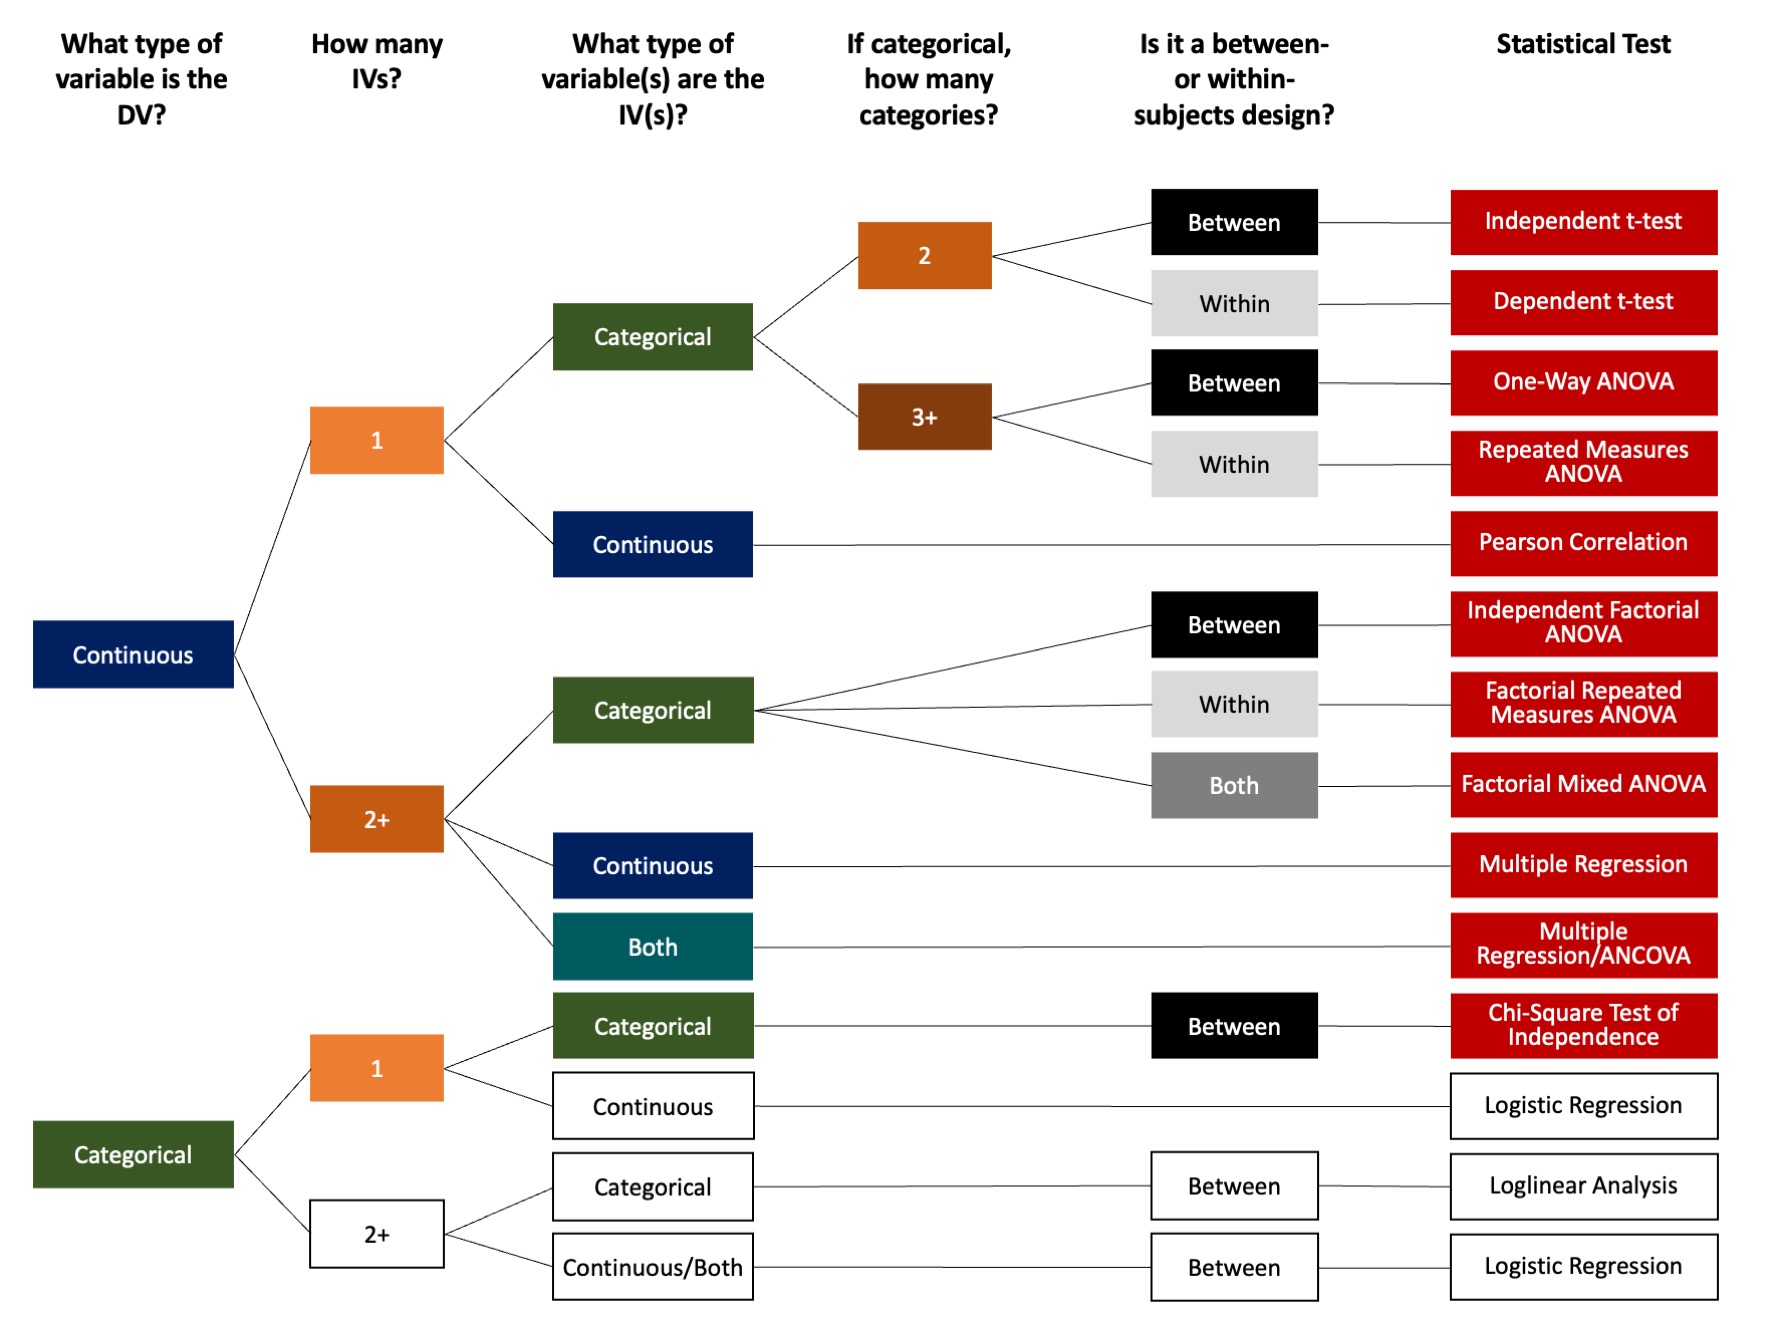
The chart uses several visual cues:
On the right of the chart are red boxes, which are the statistical tests covered in this textbook, and white boxes, which are tests we will not cover in this textbook.
The blue/green colors indicate the type of variables being examined. Blue indicates continuous variables. Green indicates categorical variables. Teal indicates both categorical and continuous variables.
The gradients of orange indicate the numbers (1, 2, 2+, or 3+) of IVs or categories within the IV.
The gradients of grey/blank indicate the type of design. Black indicates between-subjects designs, meaning different participants are in each condition. Dark grey indicates within-subjects designs, meaning the same participants are measured across conditions or time points. Light grey indicates the design has at least one between-subject IV and at least one within-subjects IV.
Another tool that can help you choose a statistical test is StatsHand. I still want you to learn the logic yourself, but tools like this can be useful for checking your thinking.
A step-by-step approach
Rather than starting by asking “Which test is this?”, start with the variables and design.
Step 1: Identify the dependent variable
The is the outcome variable. It is the variable you are trying to explain, predict, compare, or understand.
Ask yourself:
- What is the main outcome?
- How was it measured?
- Is it or ?
In this textbook, we will mostly work with statistical tests that have one dependent variable. If you are unsure whether the dependent variable is categorical or continuous, return to types of variables and levels of measurement. This is one of the most important concepts for choosing the correct test.
Step 2: Identify the independent variable(s) or predictor(s)
The is the variable used to explain, predict, or compare the dependent variable.
Ask yourself:
- How many independent variables or predictors are there?
- Is each one categorical or continuous?
- If categorical, how many levels or groups does it have?
Some tests involve one independent variable. Others involve two or more. Some tests use categorical predictors, some use continuous predictors, and some can use both.
Step 3: Determine the design
If your independent variable is categorical, ask whether the same or different participants are in each condition.
- Between-subjects design: different participants are in each condition.
- Within-subjects design: the same participants are measured in each condition or at each time point.
A helpful question is:
Can a participant be in more than one condition? Or have the participants had data on the DV collected multiple times?
If yes, you probably have a within-subjects or repeated-measures design. If no, you probably have a between-subjects design.
Forward and backward mapping
We can use the chart in two ways.
Forward mapping means starting with your research question, variables, and design, then deciding which statistical test to use. This is what you will do most often in real analyses.
Backward mapping means starting with a statistical test and figuring out what kind of data would be needed to run that test. This is not usually how you analyze data, but it can help you understand what each test is designed to do.
Forward mapping: Choose the correct test
Let’s practice choosing tests by working forward from the research question.
This video walks through how to use the statistical choices chart to decide which inferential test fits your research question, variables, and study design. If you are reading the Word document version of this textbook, you can watch the video here.
Example 1
A researcher is interested in understanding whether athletes have higher English scores than non-athletes. In other words, what is the effect of athletic status on English test scores?
- What is the DV? What is the level of measurement? English test scores are the DV, and they are continuous.
- How many IVs are there? There is one IV: athletic status.
- What is the level of measurement of the IV? Athletic status is categorical.
- How many categories does the IV have? Athletic status has two levels: athlete and non-athlete.
- Are the same or different participants used in each category? People can either be an athlete or not an athlete, but they cannot be both in this example. This is a between-subjects design.
- Statistical test? Independent t-test.
Example 2
A researcher is interested in whether people perform better on an exam at the start, middle, or end of the semester. The researcher has all participants complete all three exams.
- What is the DV? What is the level of measurement? Exam score is the DV, and it is continuous.
- How many IVs are there? There is one IV: time of exam.
- What is the level of measurement of the IV? Time of exam is categorical.
- How many categories does the IV have? It has three levels: start, middle, and end of the semester.
- Are the same or different participants used in each category? The same participants complete all three exams, so this is a within-subjects design.
- Statistical test? One-way repeated measures ANOVA.
Example 3
A researcher wants to know whether time spent studying is related to exam performance.
- What is the DV? What is the level of measurement? Exam performance is the outcome, and it is continuous.
- How many predictors are there? There is one predictor: time spent studying.
- What is the level of measurement of the predictor? Time spent studying is continuous.
- Are we comparing groups? No. We are examining an association between two continuous variables.
- Statistical test? Pearson correlation.
Backward mapping: Determine the data you need
Let me start by saying we do not normally do this. We perform the test based on the data we have and the research question we are asking.
But for learning, backward mapping can be helpful.
Imagine I gave you a dataset with these variables:
- Mile time, measured in minutes
- BMI group, with categories of underweight, normal, or overweight
- Happiness at the start of the semester, measured from 0 to 10
- Happiness at the end of the semester, measured from 0 to 10
Backward mapping example 1
If I told you I wanted you to perform a dependent t-test, what data would you use?
A dependent t-test requires a continuous dependent variable measured across two related conditions or time points. In this dataset, happiness is measured at two time points: start and end of the semester. Therefore, we could perform a dependent t-test to examine whether happiness differs from the start to the end of the semester.
Backward mapping example 2
If I told you I wanted you to perform a one-way independent ANOVA, what data would you use?
A one-way independent ANOVA requires one continuous dependent variable and one categorical independent variable with three or more levels, using different participants in each group. In this dataset, BMI group has three categories. Mile time is continuous. Therefore, we could examine whether mile time differs by BMI group.
Keep in mind that this would not be an experimental design. We are not randomly assigning people to BMI groups. So we could describe differences by group, but we would need to be careful about causal language.
Common wrong turns
Choosing the correct test takes practice. Here are some common mistakes to watch for:
- Choosing based on the name of the variable instead of how it was measured.
- Forgetting whether the same participants were measured more than once.
- Treating a categorical dependent variable like a continuous dependent variable.
- Using ANOVA just because there are multiple variables, when the key issue is the number of groups or levels.
- Forgetting that assumptions may change the exact test you interpret.
TipCheck Your Understanding
For each scenario, identify the likely statistical test if assumptions are met.
- A researcher asks whether anxiety scores differ between students who drink caffeine and students who do not.
- A researcher asks whether stress scores differ before, during, and after finals week for the same students.
- A researcher asks whether hours of sleep are related to reaction time.
- A researcher asks whether political affiliation is related to voting method, where both variables are categorical.
- A researcher asks whether motivation differs by class year (first-year, sophomore, junior, senior).
NoteSuggested Answers
- Independent t-test: continuous DV, one categorical IV with two between-subjects groups.
- One-way repeated measures ANOVA: continuous DV, one categorical within-subjects IV with three time points.
- Pearson correlation: two continuous variables.
- Chi-square test of independence: two categorical variables.
- One-way ANOVA: continuous DV, one categorical between-subjects IV with four groups.