6.6 Expanding Your Data Visualization
The Plots tab in jamovi provides enough flexibility for many course assignments and common research questions. However, creating an effective visualization requires more than selecting the correct plot type.
Make the Message Clear
A graph should be understandable without requiring the reader to inspect your dataset or analysis setup.
Before using a graph in an assignment or report, check that:
- The title communicates what is being shown.
- The axes describe the variables in reader-friendly language.
- Units are included when needed.
- The legend is clear and only included when necessary.
- Category labels are readable.
- Counts, percentages, means, and error bars are identified accurately.
- The graph emphasizes the comparison relevant to the research question.
Avoid using raw variable names such as Q17_total as titles or axis labels when a descriptive phrase such as Job Satisfaction Score would be clearer.
Avoid Misleading Graphs
Even technically correct graphs can mislead readers. Watch for the following issues:
- Using counts to compare groups with very different sample sizes
- Truncating an axis in a way that exaggerates small differences
- Connecting unordered categories with a line
- Displaying group means without showing or describing variability
- Using too many categories, groups, labels, or decorative elements
- Treating possible outliers as errors without investigating them
- Choosing a plot because it looks impressive rather than because it answers the question
Going Beyond jamovi
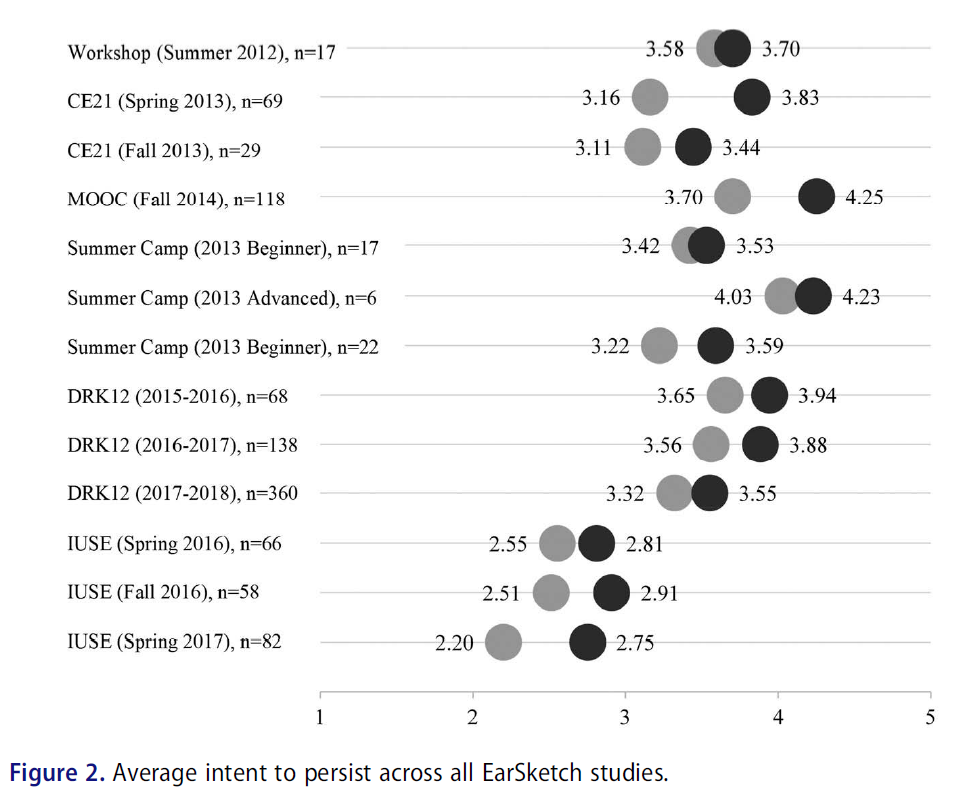
Although jamovi can create many useful plots, other programs provide additional flexibility. For much of my work, I use Excel because it is relatively easy to create polished and highly customized figures. Here’s an example of a visualization made in Excel1:
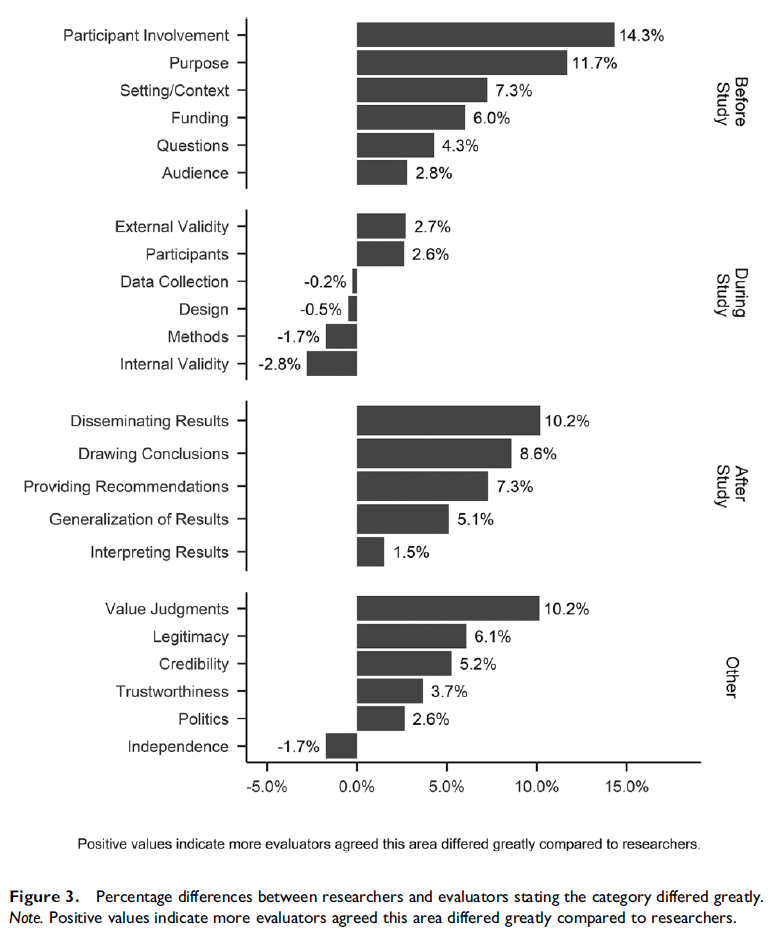
For more complicated figures, I use the ggplot2 package in R. Here’s an example of a visualization made in R2:
The software may change, but the underlying goal remains the same: choose a visualization that helps the reader understand the data accurately and efficiently.
A graph of average scores across two groups begins its y-axis at 98 rather than 0. The group means are 99 and 100, but the bars appear dramatically different.
What concern should you have when interpreting the graph?
The truncated axis exaggerates the visual difference between the groups. A truncated axis is not always inappropriate, but the scale should be chosen and labeled carefully so that readers are not misled about the size of the difference.