2.3 Descriptive vs. Inferential Statistics
Once we understand what kind of variables we have, the next big distinction is whether we are describing the data we collected or using those data to make a larger claim.
That is the difference between descriptive and inferential statistics.
By the end of this section, you should be able to:
- define descriptive statistics and inferential statistics
- distinguish between a sample and a population
- explain why researchers often use samples to make inferences about populations
- identify when a research question is descriptive versus inferential
- explain why we usually need both descriptive and inferential statistics
Descriptive Statistics
summarize, organize, and describe the data we have.
For example, if I collect data from 80 students, descriptive statistics help me describe those 80 students. I might report:
- the average quiz score
- the standard deviation of quiz scores
- the percentage of students in each major
- the number of students in each condition
- a graph showing the distribution of scores
Descriptive statistics do not, by themselves, tell us whether the same pattern would appear in a larger population. They describe what happened in the sample.
Inferential Statistics
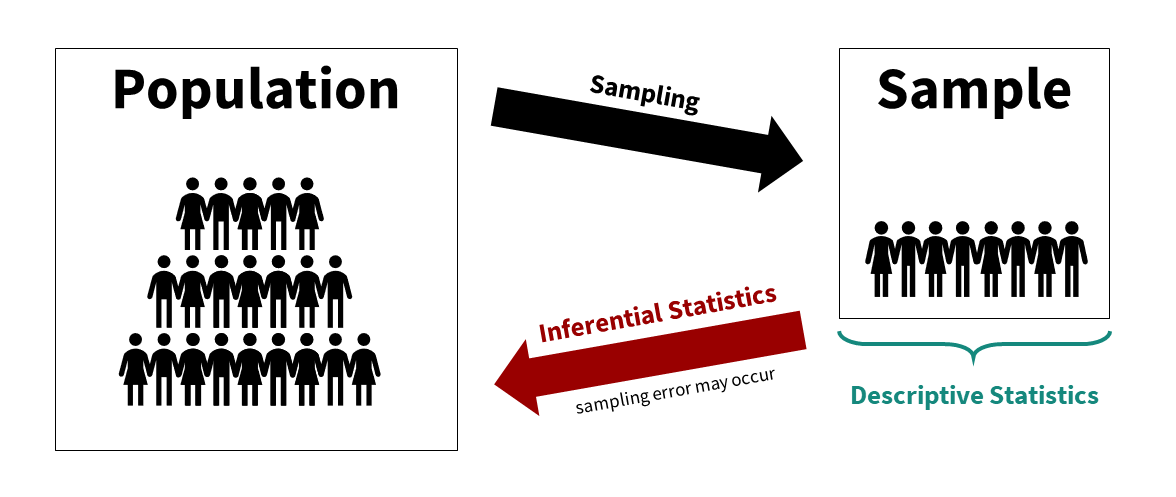
help us use data from a to make inferences about a larger .
A population is the larger group we want to understand. A sample is the smaller group we actually collect data from.
In research, we often cannot collect data from an entire population. We may not have enough time, money, access, or permission. Instead, we collect data from a sample and use inferential statistics to ask how much confidence we should have that the pattern in the sample reflects something about the population.
This is why inferential statistics are so important. They help us move from “what happened in these data?” to “what might this tell us about the larger group we care about?”
Population, Sample, and Inference
Imagine I want to know whether a new study strategy improves quiz performance for college students.
The population might be all college students. That is much too large for me to study directly. So I collect data from a sample, perhaps students in several introductory psychology classes.
I can use descriptive statistics to describe the students I actually studied. I can use inferential statistics to ask whether the results from that sample provide evidence about the larger population of students I care about.
The quality of that inference depends on many things, including how the sample was selected, how the study was designed, how the variables were measured, and how much variability exists in the data. We will return to these ideas throughout the book.
A Research Example
Let’s make this more concrete.
Imagine we are conducting a study examining whether watching video lessons on effective studying improves test performance compared with watching a funny television show. I will use Schitt’s Creek as the funny show because it is excellent, but I will reluctantly admit that it is probably not the best way to study for an exam.
The population of interest might be college students. Because we cannot include all college students, we collect data from a sample of students. We randomly assign some students to watch study-skills videos and others to watch Schitt’s Creek. A week later, everyone takes the same quiz.
First, we describe the sample. We might report the average quiz score in each group, the standard deviation in each group, and a graph showing the score distributions. That is descriptive statistics.
Then, if we want to know whether the difference between groups is large enough to suggest that the study-skills videos would help students beyond this specific sample, we need inferential statistics. Later in the book, we will learn that this kind of question could be tested with an independent-samples t-test.
We Usually Need Both
Descriptive and inferential statistics are not competing options. We typically need both.
Descriptive statistics help us understand what is in our data. Inferential statistics help us evaluate what we can reasonably conclude beyond our data.
A good statistical analysis rarely jumps straight to the p-value. We first describe the data, look for patterns, examine variability, and make sure the analysis makes sense.
Descriptive or Inferential?
Here is a quick way to think about the difference:
| Question | Type of Statistics |
|---|---|
| What was the average quiz score in this sample? | Descriptive |
| What percentage of participants selected each response option? | Descriptive |
| Is there evidence that the intervention improved scores in the larger population? | Inferential |
| Is the relationship between stress and sleep likely to exist beyond this sample? | Inferential |
The key question is whether you are only describing the data you have or trying to make a claim beyond those data.
- What is the difference between a sample and a population?
- A researcher reports that 62% of participants in their sample selected “yes.” Is that descriptive or inferential?
- A researcher asks whether a difference found in a sample likely reflects a difference in the larger population. Is that descriptive or inferential?
Answers
- A population is the larger group we want to understand. A sample is the smaller group we actually collect data from.
- Descriptive. It summarizes the data in the sample.
- Inferential. It uses sample data to make a claim about a larger population.