5.5 Choosing and Writing Descriptive Statistics
Descriptive statistics are not just numbers you produce. They are information you communicate to help readers understand your data.
The key is to choose descriptive statistics that match the variable and the purpose.
Choosing Descriptive Statistics
Here is a general guide:
| Variable type | Useful descriptives | Usually avoid |
|---|---|---|
| Nominal | counts, percentages, mode | mean, standard deviation |
| Ordinal | counts, percentages, median, range/IQR when appropriate | assuming equal spacing without thought |
| Continuous, roughly symmetric | mean, standard deviation, minimum, maximum | reporting every statistic available |
| Continuous, skewed or with outliers | median, IQR, range, sometimes mean/SD with caution | relying only on the mean |
| Continuous by group | group-specific mean/SD or median/IQR, group n | claiming significance without a test |
These are guidelines, not laws. Your research question and audience matter.
Writing Descriptive Statistics in Text
For a small number of variables, you can often report descriptive statistics in a sentence or paragraph.
For example:
Participants reported moderate boredom scores (M = 2.72, SD = 0.99) and somewhat higher mind wandering scores (M = 3.45, SD = 0.99).
This sentence gives the reader the central tendency and spread for both variables without overwhelming them.
Simple Writing Templates
For a continuous variable:
Scores on [variable] ranged from [minimum] to [maximum], with a mean of [M] and standard deviation of [SD].
For a categorical variable:
Most participants were [category] ([n], [%]), followed by [category] ([n], [%]).
For a continuous variable split by group:
Participants in [group 1] had a mean [variable] score of [M] (SD = [SD]), whereas participants in [group 2] had a mean score of [M] (SD = [SD]).
These are templates, not scripts. Your final write-up should always make sense for the variable, research question, and audience.
When to Use a Table
If you have many variables or many categories, a table may be clearer than a paragraph.
The old rule I use is this: if the paragraph becomes a wall of numbers, it probably wants to be a table.
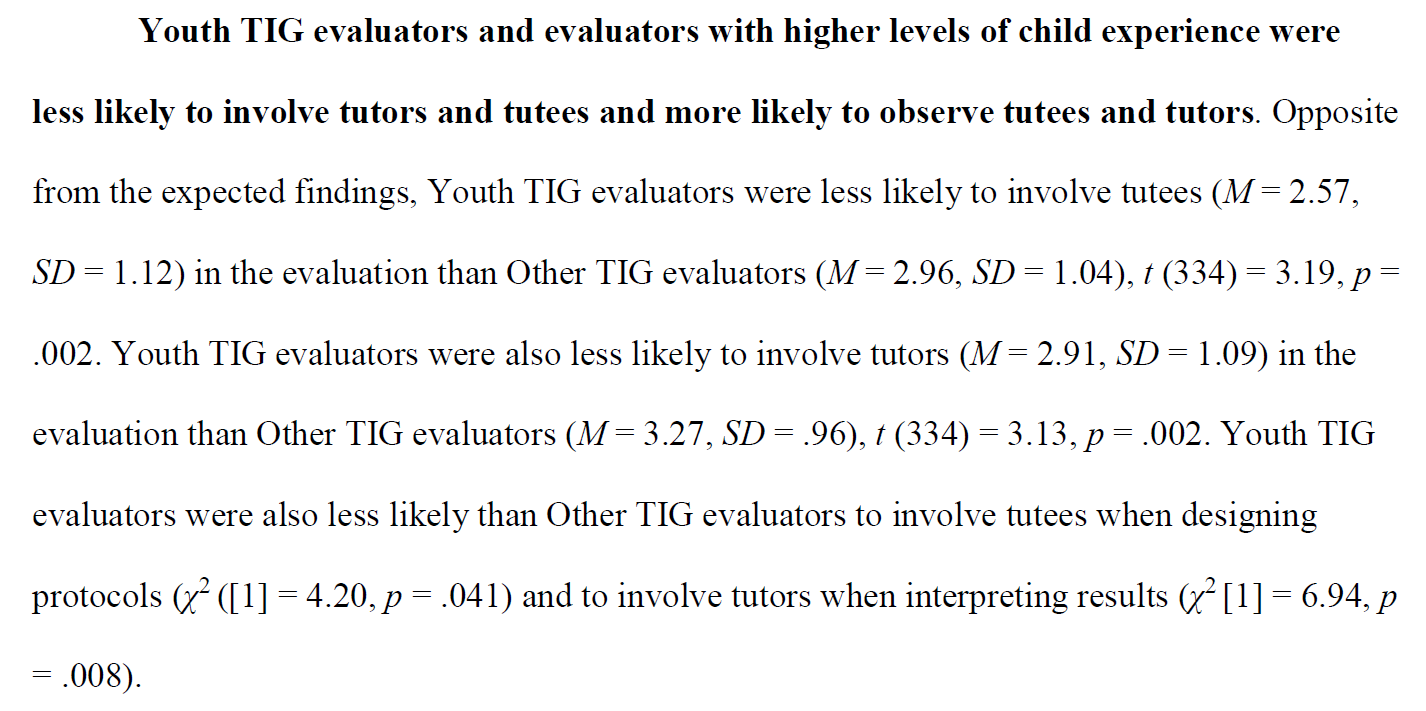
Here is an example of descriptive statistics reported in a paragraph from applied research:
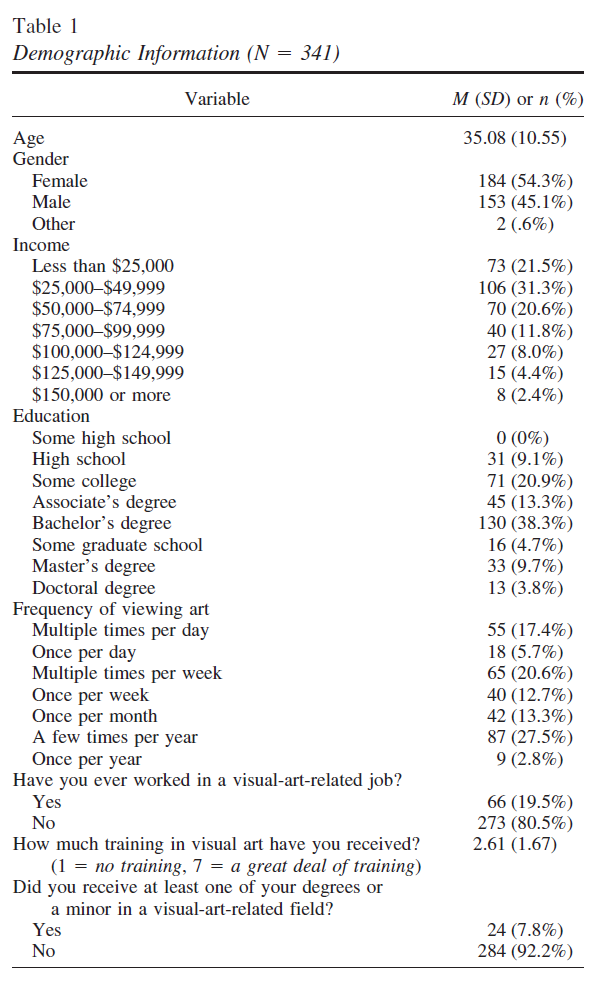
And here is an example where a table is more efficient because there are many variables to summarize:
APA-Style Details
When writing descriptive statistics in APA style:
- italicize statistical symbols such as M, SD, and n when appropriate
- round consistently, often to two decimal places for means and standard deviations
- define variables clearly enough that the reader knows what was measured
- do not report unnecessary statistics just because jamovi produced them
A paragraph includes means, medians, modes, standard deviations, variances, minimums, maximums, skewness, kurtosis, and frequency tables for two variables. What is the likely problem?
Answer
The writer is probably reporting too much output without deciding what the reader actually needs. Descriptive statistics should be selected based on the variable type and purpose.