6.4 Filter
Sometimes we only want to analyze certain pieces of our data. We can filter by rows and by columns. Check out this blog post by jamovi on more details of filters.
Row filters
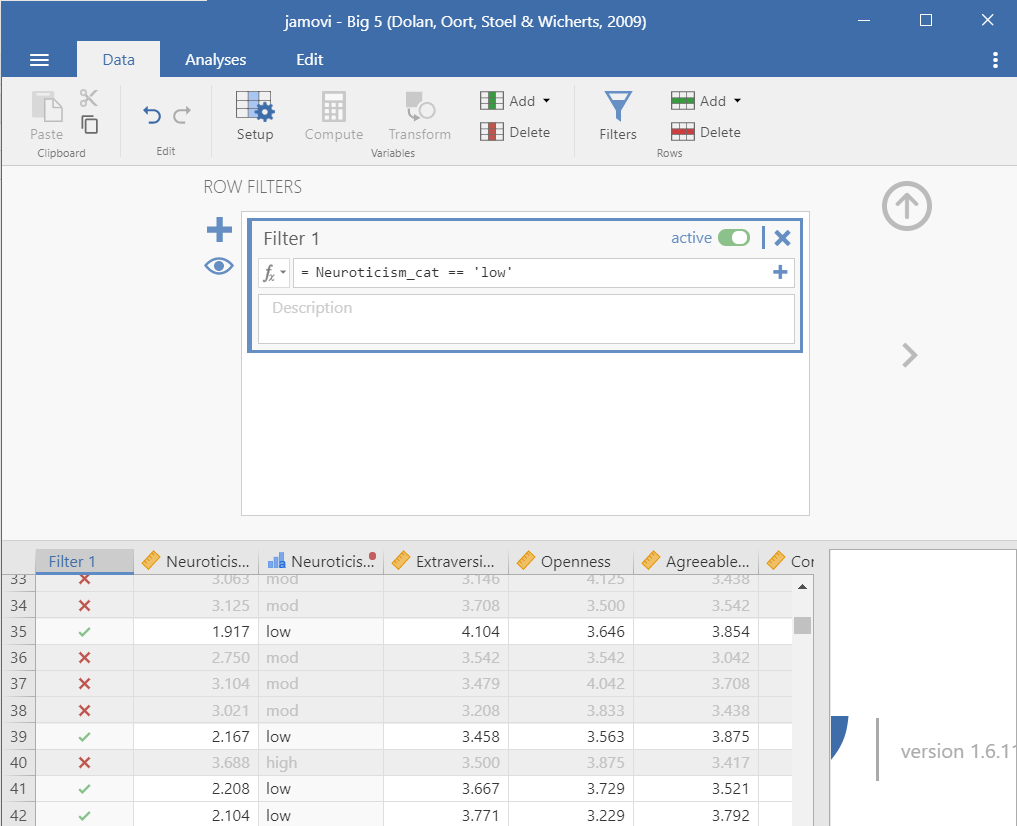
Let’s imagine we only want to analyze data from people who are low in neuroticism. We would create the following filter:

You’ll notice in the dataset it will add a new column named Filter 1 (the name of the filter) and there will either be an X or a green check mark indicating whether it’s removed (X) or kept (check) in the analyses.
If you want to take off the filter, but keep it available, click on the filter column and toggle the green button on the top right from active to inactive. It will then grey out the column, meaning it’s not being used.
A couple things to note:
Commonly, we want to specify the variable equals something. You would use the double equal sign:
==Another common thing you may want to specify is that the variable is not equal to something. You would use the following:
!=Otherwise you should be familiar with the other operations from previous math courses:
<,>,<=,>=
Column filters
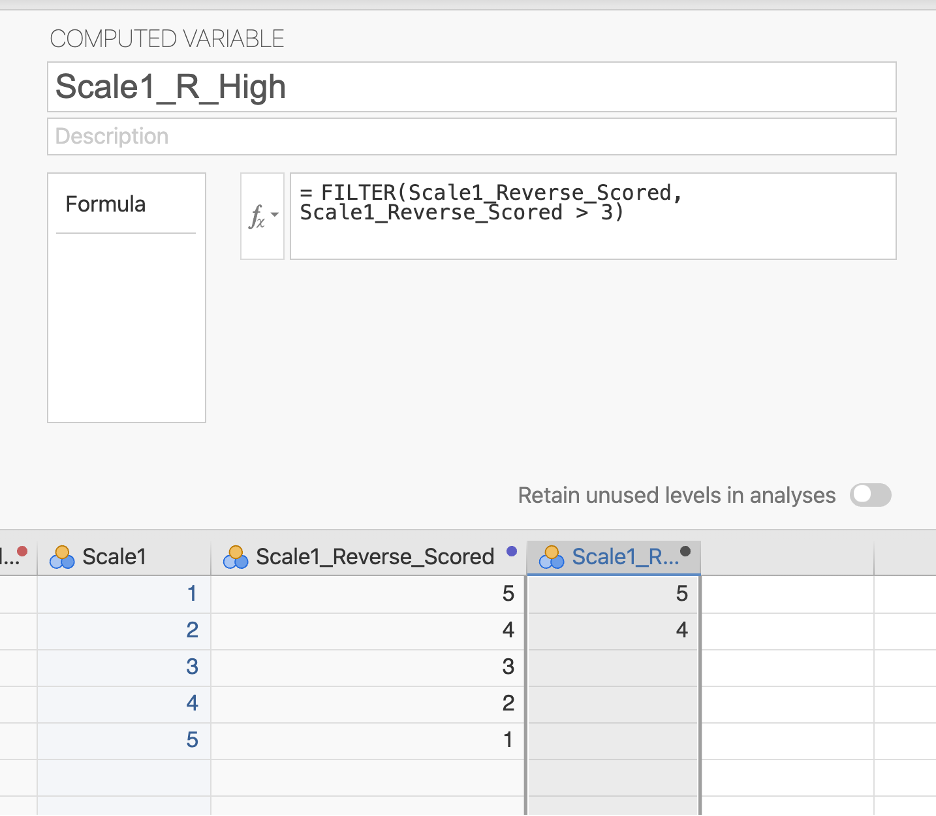
Column filters are useful when you want to use a filter for some but not all of your analyses. Rather than creating a filter, we need to compute a new variable using the FILTER() function.
For example, we learned how to reverse score our hypothetical happiness item above. We could then say we only want people who are high in that variable for another analysis. We could apply a column filter that is FILTER(Scale1_Reverse_Scored, Scale1_Reverse_Scored > 3) .
